Introduction
On Sept 7, I wrote about why Labor lost the 2019 election and said I had co-authored a paper discussing the reasons. I then went onto ask if the Sports infrastructure grants had also played any part in that loss. Showing a graph of total funding for 2019 which was roughly an extra $100 Million, and almost the same number as the Sports infrastructure grants.
Having listened to the press coverage and become somewhat disenchanted with the lack of precision and detail in the various media stories, I did my own analysis and have published the results as well as two graphs in Part 1 of this story. They showed a very bad bias toward Coalition seats. That discussion can be viewed here.
Following that analysis, I sent it to a few friends for comment and as I now had the bit firmly between my teeth, I continued researching.
Don’t forget, The Sport Australia organisation is NOT a department of government, it’s a body corporate and so reports it’s own grants schemes on it’s web site.
In relation to reporting grants schemes, I found out the following.:-
Before 1 Jan 2018, all grant reporting was done on the website of the responsible department.
Those arrangements changed after 1 Jan 2018, when a Government Portal called GrantConnect was “Stood up” hence forth all departments would report their grants through this portal.
Around about the same time as this I received an email asking me to help with spreadsheet assistance. The proposition was a follow on from my analysis of why Labor lost the election. The hypothesis being that they had targeted marginal seats and favoured them above safe seats.
When examined in detail this hypothesis is a bit sloppy, not in it’s construction, but in the definition of safe and marginal. What is that definition? It’s different for everyone. However there are ample resources in the AEC data to make up a definition and defend it.
The grants data I was asked to analyse were the Community Development Grants, administered by the Department of Infrastructure, Regional Development and Communications.
This wasn’t to be a short 4 month program, it was to look at data back to 2013, when the CDG scheme was funded in the 2013-2014 MYEFO (Mid Year Economic and fiscal outlook).
I agreed to do the analysis if I could source data which identified Post codes and localities and could link them to each of the federal Electorates.
I had in mind a “Master key” which would sit outside any downloaded spreadsheet data (GrantConnect delivers results in excel spreadsheet format, with a tonne of information, but without the electorate identified). To do any meaningful analysis this “Master Key” needed to be constructed.
At this time it’s also opportune to look at the size of the task. From Grant connect in 2018 there were 24,447 grants granted for a value of $15,377,056,651.68 ($15 Billion).
In 2019 there were 24,003 grants granted for a value of $15,698,594,979.40.
48,450 grants in 2 years. I didn’t fancy looking up every electorate manually, because 684 grants had taken me 4 days.
The department of Infrastructure had granted 2711 grants in 72 grant schemes in 2018 and 3990 grants in 48 grant programs in 2019.
Community Development grants were one of these grant schemes.
Methodology of analysis.
Following the revelation of the size of the project, it was time to build my “Master key.” The first thing I did was to download all of the Post codes and localities in Australia. All 17,700 of them and place them into a spreadsheet. This took a couple of days of cutting and pasting and then a short tidy up of the file.
Now I needed to match the Postcode/locality data with the electorate boundries for the 2019 election year.
This took another two days following a phone call to an IT expert friend of mine in Canberra. I explained the problem and graciously he returned a match file to me in a further two days.
However there was still a small amount of grunt work to do and that was add the Political party, sitting member and then the margin they won by in the 2019 election.
That done I now had my “Master file” and must acknowledge my good friend Steve for doing his IT excellence and providing the electorate match.
Everything had now become a whole lot easier. I reviewed the somewhat pedestrian way I had done the analysis of the Sports Infrastructure grants and decided much improvement was possible, not with the result but the way to get to the result. In other words without as much manual work.
I am going to describe what I did and how I did it. The reason? Well if I don’t then the Naysayers will be around saying Bullshit, Vince is telling Porkies.
So here goes.
Firstly the output of any data from the grant connect database is in Excel format. Excel is a very powerful program, which just doesn’t add multiply and divide, it has some brilliant features. I used two of them to do the analysis.
Firstly I did a data filter on the Columns. What in effect that does is organise repeating data in alphabetical or numerical order. For example I wanted to analyse the Department of Infrastructure grants, So in the drop down menu I ticked the little box next to Dept of Infrastructure and every other piece of data disappeared (was hidden). Only Infrastructure was left. I then went along to the column which showed Grant type and out of the 2711 grants in 72 different grant schemes for 2018, I choose Community development grants and that set of data appeared.
I could now add up the number of grants, the value of these grants but I couldn’t work out to which electorates and political parties they were allocated.
At this point I then used the second main feature of Excel. Firstly I had to add 4 columns. After I had added them I wrote 4 formulas against the individual grants and checked the postcode in the GrantConnect data against my “Master key” returning the Electorate, Political party, sitting member and margin for that grant. I then copied those formulas down for all the data and now had a completed Community development grants spreadsheet master which was ready for analysis.
Bear in mind that I had three spreadsheets with CDG data. The grants before 1 Jan 2018, which was on the Dept Infrastructure Website, the 2018 and 2019 years which were sourced from the GrantConnect Portal.
My friends had given me their defined marginal seats to analyse for each year. The results were inconclusive and produced no smoking gun, which was initially disappointing, but the more we discussed and analysed the hypothesis, the more we realised we would have to analyse all 151 seats in the parliament.
Having come to this realisation, there was nothing else to be done but the analysis.
A note about the Crosschecking protocol used.
As I was doing the analysis I made sure that I added up the results in two ways to check that I didn’t make any mistakes. Adding across rows and columns and then comparing the results which should have been the same and correcting any problems if they were different.
I also did the checks twice to make sure that nothing was missed. In this way I managed to catch and rectify any mistakes made along the way.
Here is the result of that analysis for the three spreadsheets analysed.
- Community Development grants before 1 Jan 2018
- Community Development grants for the year 2018
- Community development grants for the 2019 year.
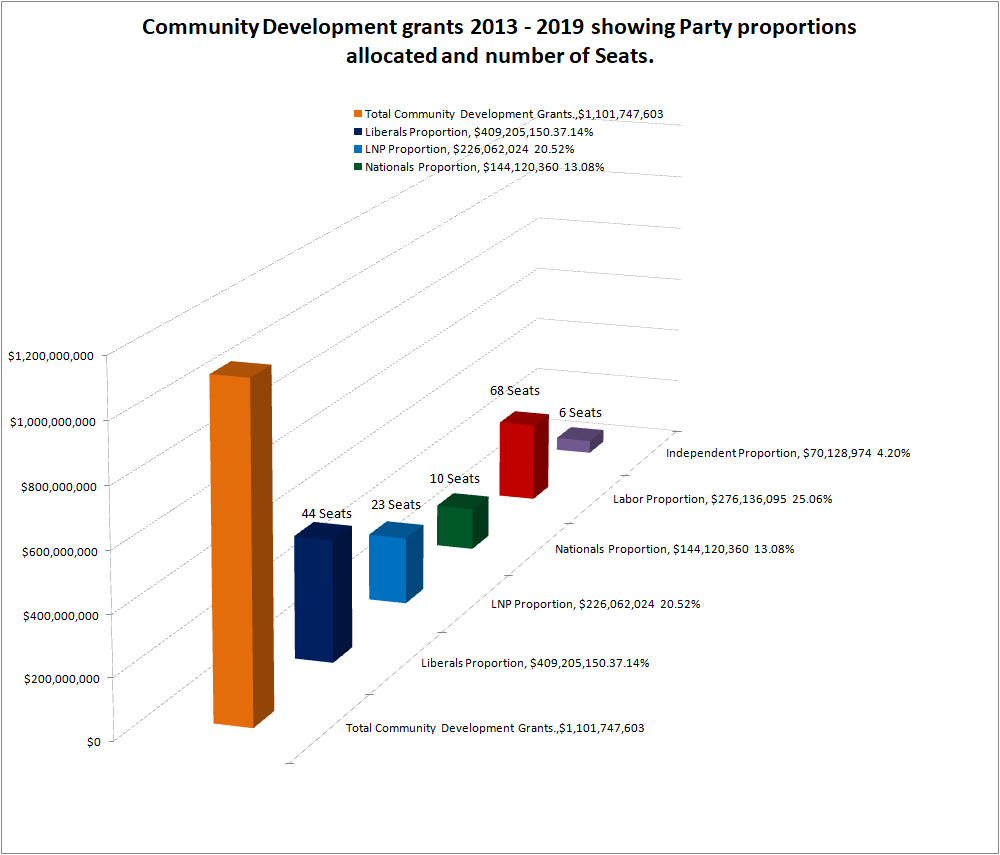
Spreadsheet Analysis of Community Development grants 2013- 2019. Prepared by V.O’Grady 2020.
| Total Spent | $1,101,747,603 | ||
| Total Labor Grants | $276,136,095 | 25.06% | |
| Total Coalition Grants | $779,387,534 | 70.74% | |
| Independents | $46,223,974 | 4.20% | |
| Total Nationals | $144,120,360 | 13.08% | |
| Total LNP | $226,062,024 | 20.52% | |
| Liberals | $409,205,150 | 37.14% | |
| $1,101,747,603 |
As you can see these grants were worse than the allocation given to Labor electorates in the Sports Community Infrastructure grants and that was only a scheme worth $100 million where Labor got 31.54 % of the total value and have only 9 seats less than the Coalition.
In this scheme which has been running since 2013, 68 Labor electorates got a percentage of 24.53% or $276,136,095 of a total value of $1.12 billion.
As you can see Coalition seats got 69.24% of the value or $779,387,534.
What is most shocking about these figures is that the 23 LNP seats in Queensland and the 10 other Nationals seats in NSW and Victoria added together make 33 seats and together they were awarded $370,182,384 or 32.88% of the $1.12 billion. Eight percent more than Labor’s 68 seats.
So Labor averaged $4M per seat (68 Seats)
Nationals averaged $14M (10 seats)
LNP averaged $9M per seat. (23 Seats)
The Liberal party averaged $9,M per seat (44 seats)
Independents averaged $11,M per seat. (6 Seats)
Here are two graphs of the distribution.

and by Seat.
It must be remembered that this scheme was implemented in the 2013-2014 Mid Year Economic and fiscal Outlook (MYEFO) and that the funding was allocated over 6 years.
It must also be pointed out that Electoral divisions (Electorates) have a range of voters in them. This range is from around 90,000 voters up to 120,000, but the majority are around 105,000 so one could reasonably expect that the the value of funds allocated via grant streams such as Community Development Grants would be roughly the same. However what the analysis shows is that somehow 68 Labor seats got an average of $4 million per seat and 77 coalition seats got an average of $10 million per seat. Whilst independent seats also did well with an average of $11 per seat.
I had always wondered why people voted for certain MP’s, especially some of the Queensland Nationals and some of the New South Wales Nationals. I think I have my answer. They deliver the money in bucketloads.
So what do you, the reader think of this allocation of grant money?
Is it fair and equitable? Or is the Pork in the Barrel?
Part three will analyse another $714 Million of Regional Grants programs.
Stay tuned.
Mea Culpa. 25 Sep 2020. 2.48pm.
Whilst charting some of these Data, I was asked if I could show the data in a different way and went to look at the spreadsheet summary. Whilst the Summary of the three grants schemes years for their particular years added up to $1,125 billion on the left, the sum of the three columns added up to $1.1 billion.
After looking for a while I found that the sums down the left added up two extra rows (because I had moved those rows) with the same values. This was a mistake I made by not checking the sums vertically and horizontally.
The mistake has now been rectified and the data labels and percentages adjusted accordingly.
This mistake of addition does not change the veracity of the base data.

2 comments